15 minutes
MISP - Gamification in Cyber Threat Intelligence
Summary
The cyber threat intelligence community might soon see gamification become a standard feature of the MISP landscape.
MISP-Dashboard, an experimental feature set of the MISP project, introduces gamification of cyber threat intelligence through a leaderboard upon which organisations compete by contributing intel within their sharing group. The gamification of MISP is likely to be attractive to a community known for highly competitive CTFs but also to organisations looking to promote their CTI capabilities.
This post explores the available features of misp-dashboard and possible unintended side-effects of gamification on the cyber threat intelligence community.
MISP-Dashboard is currently in alpha.
MISP
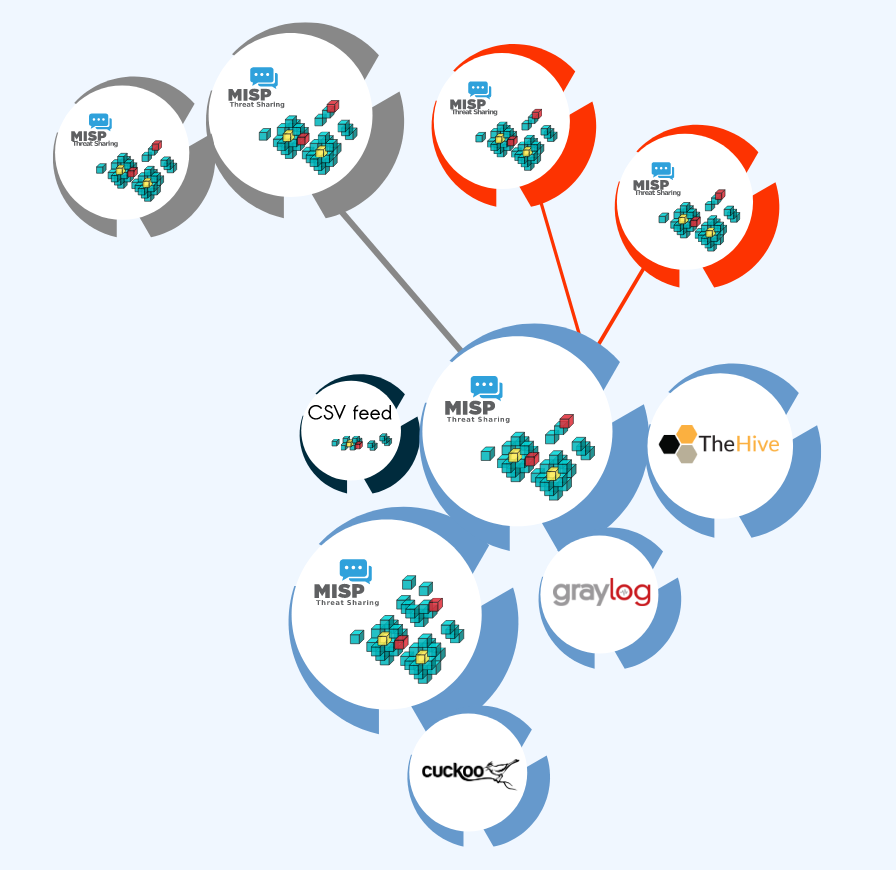
The MISP threat sharing platform is a free and open source software helping information sharing of threat intelligence including cyber security indicators.
A threat intelligence platform for gathering, sharing, storing and correlating Indicators of Compromise of targeted attacks, threat intelligence, financial fraud information, vulnerability information or even counter-terrorism information.
The MISP platform helps organisations maximize the value of their threat intelligence.
MISP is a lot more than just a repository for collecting and sharing IOCs. It’s better framed as a platform for correlating and contextualizing data. In environments where analysts face massive amounts of indicators it’s important they’re able to easily relate those data points to the big picture.
The platform’s very popular with the cyber threat intelligence community. It’s used by NATO, by national CIRTs, national and commercial financial institutions, ISACs, and more than 6000 organisations according to the MISP website.
If you’re not familiar with MISP, I recommend you check out the features, boot up an instance and page through the latest training materials.
MISP-Dashboard
MISP-Dashboard is a web app for real-time visualization of MISP threat intelligence.
It includes several default visualization dashboards including a live-feed of recent attributes, user analytics and trendings.
MISP-Dashboard could be particularly beneficial to organisations just getting started in CTI. By providing a set of sane default visualizations, misp-dashboard may lower the barrier to entry of working with MISP by drawing attention to important data, notably the aggregation of tags, and guiding analysts in asking pertinent questions.
Much of the content will look familiar to orgs already integrated with a SIEM, but the trendings dashboard and live-feed provide enough out-of-the-box utility to make the project worth setting up and exploring.
However, visualizations are arguably the least interesting component of misp-dashboard. What really makes misp-dashboard shine is that it introduces a foundation for gamifying work in the MISP platform through it’s global ranking system.
Gamification of Cyber Threat Intelligence
Gamification of cyber threat intelligence is the most innovative feature of misp-dashboard.
The core idea is simple. Organisations are awarded points for their contributions to the MISP community, and by gaining points are granted prestigious titles and badges for the purpose of gloating. It’s kind of like a real-world cyber threat intelligence CTF. So it’s brilliant really.
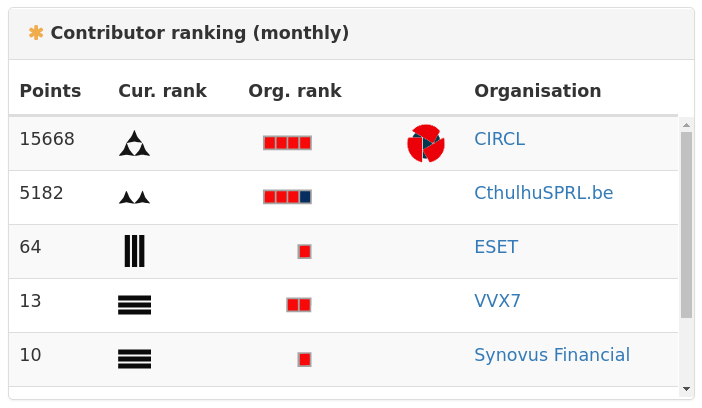
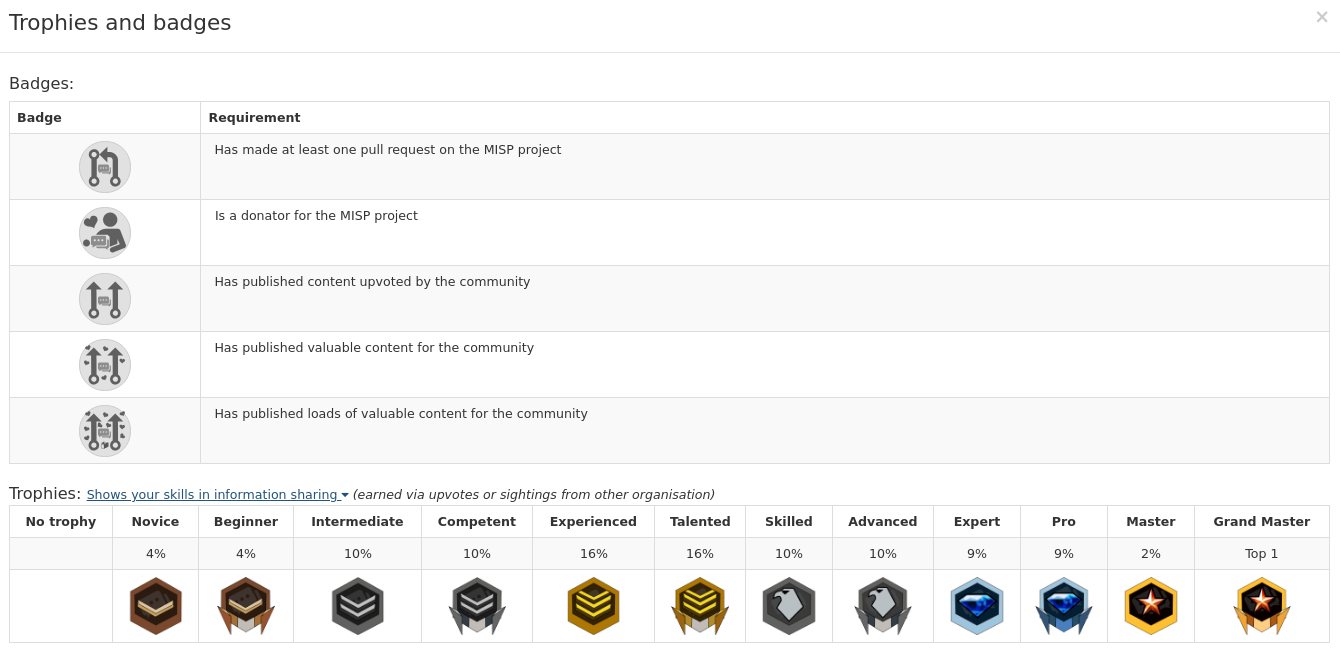
There are currently 16 possible titles of exponentially increasing point requirements from Ensign (2 points) to Grand General (16384 points + regular quality content).
Badges signify particular meaningful contributions such as donating to the MISP project, contributing valuable content, or submitting a pull request.
Points are awarded for efforts including reporting sightings and creating attributes. If your organisation doesn’t contribute IOCs to the public (you probably should though), points can still be earned by reporting sightings of public events.
The MISP Contributors dashboard contains several distinct boards, so in addition to the monthly global leaderboard, one can view the top contributors in each category of attribute, the latest contribution, and latest awards.
One Weird Trick
I’ll be damned if I contribute to FOSS because it’s right, but give me some rare Internet .jpeg’s and those unused vacation days start burning a hole in my pocket!
Someone, probably
It’s my personal experience that lots of folks in infosec are hyper-competitive.
It is also my personal experience that Cyber Threat Intelligence requires a lot of networking, professional relationships within your industry, at ISACs, and so on.
In that context, the value of fostering competition between organisations to share IOCs (or contribute to the MISP project) might be obvious, but there is also an element of intra-organisation competition worth exploring as well.
Many large organisations operate several compartmented security teams and struggle with sharing intelligence between them. Sometimes it’s technological impediments where teams are isolated by differences in their technology stacks. Sometimes it’s lack of adequate communication channels or the impedance to use them. Sometimes it’s just plain old politics.
Whatever the reason, we want all that parallel effort consolidated in a single platform. Members of an organisation should refer to a single record of truth, so regardless of who needs the data, or it’s intended use, CTI makes available one interface through which all threat intelligence flows. Intuitively it makes sense, but we need folks to actually use the thing.
The secret ingredient is competition.
The recipe is pretty simple; take the security teams, inform them their performance is being put on display, and that CTI Eve said Red Team Alice is like little baby with Ghidra. And then you let the chaos unfold encourage teams to show what they’re made of.
Until MISP supports organisation trees, each team will need to be configured as a distinct local organisation. This is fine for internal use, but could cause confusion if the teams are sharing indicators within a sharing group (such as ISAO or other industry members).
To get started, set up local organisations in MISP for each team and ensure users are appropriately placed within their local org.
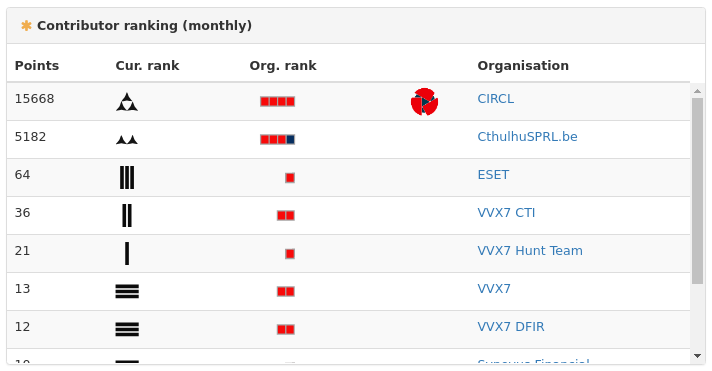
The image above shows are several fictitious teams. As evidenced by points, VVX7 CTI is superior to VVX7 Hunt Team.
For the purpose of competing on a global leaderboard, the points of the internal teams VVX7 CTI and VVX7 Red Team would be better aggregated under the single public facing organisation VVX7. The folks at MISP may want to consider organisation trees for this reason.
One caveat in setting up teams in this way is that points are awarded to the owner of the event and not the user performing the action. If Eve adds an attribute to Alice’s event, it is Alice’s team which will receive points for this action. This isn’t ideal for teams competing against each other, but it is useful for understanding which events are the most active.
Abusing the Leaderboard for Fun and Profit
I’m heavily biased in favour of gamification.
I learned about security through CTFs and to program through sites like CodeWars. But in those environments the stakes are low. If someone games the system to artificially inflate their score, it doesn’t really matter. It’s not actually important.
Reputation (or at least the perception of it) within the CTI community is important.
The problem with the current misp-dashboard implementation is lack of controls to prevent cheating. Anyone can grind a massive score, without contributing anything meaningful, in a dozen lines of Python.
There are good reasons why we’d want to prevent gaming the system and they have nothing to do with ethics or sport.
Internal to an organisation, incentive to manipulate a score exists primarily for inflating perceived performance where performance optics are important to analysts, team leaders and stake holders.
That’s no good, but the real risk is that an organisation may overestimate it’s CTI capabilities and make poor decisions trading on that information.
On a global leaderboard the stakes are a lot higher. We work in an industry which specializes in abusing systems in unexpected ways and then weaponizing the findings. There are all sorts of weird incentives which make a case to optimise for Internet points rather than for producing high-fidelity indicators.
- Optics of having/managing/creating a capable CTI team.
- Threat deterrence from being a ‘harder’ target.
- Relevance/reputation within the industry.
- HR bait & career prospects.
- Intelligence gathering.
- Disinformation.
Consider the incentives for sharing false information. It’s reasonable that an adversary may seek to poison an ISAO for the purpose of obfuscating their operation (such as falsely correlating an operation of Oceania Group with Eastasia Group). On the surface their participation within the ISAO must look legitimate. The adversary contributes to the MISP community via reported sightings, adding attributes, or resubmitting public indicators for points. The adversary may or may not be effective in producing any new indicators, but it doesn’t have to be. There’s no expectation to be effective built into the system. It may look suspicious if the adversary is the only org reporting correlation between Oceania Group and Eastasia Group, so the adversary will want to replicate their findings across several fronts.
Nothing stops an adversary from doing that now, but with an unregulated leaderboard the bar is lowered for low-resource actors to manufacture authority. If one or more of the top orgs on the leaderboard are reporting Oceania Group == Eastasia Group, should that information not be considered and investigated? If not, it’s questionable to want a leaderboard that shows who has the most to say, if we’re not interested in what is being said. If the intel is considered, it must take some non-zero amount of time to investigate. If only prolonging an investigation by a few days, it must surely be profitable for an adversary given the negligible cost of operating a MISP instance.
Some organisations will go through the trouble of checking the credentials of an org on the leaderboard, but I expect that most won’t, and will accept the org’s ranking as validation of it’s legitimacy.
Out of courtesy I reached out to the developers prior to this post to voice my concern. The devs are already aware of the potential for cheating. I’m confident it’s something they’ll work out before misp-dashboard is ready for production.
If you have an idea on how to prevent cheating I encourage you to open an issue on their GitHub or send me an email.
MISP Trendings Dashboard
MISP Trendings are what you might expect from a SIEM dashboard.
Currently the dashboard mostly aggregates event activity and attribute data to show high-level daily trends.
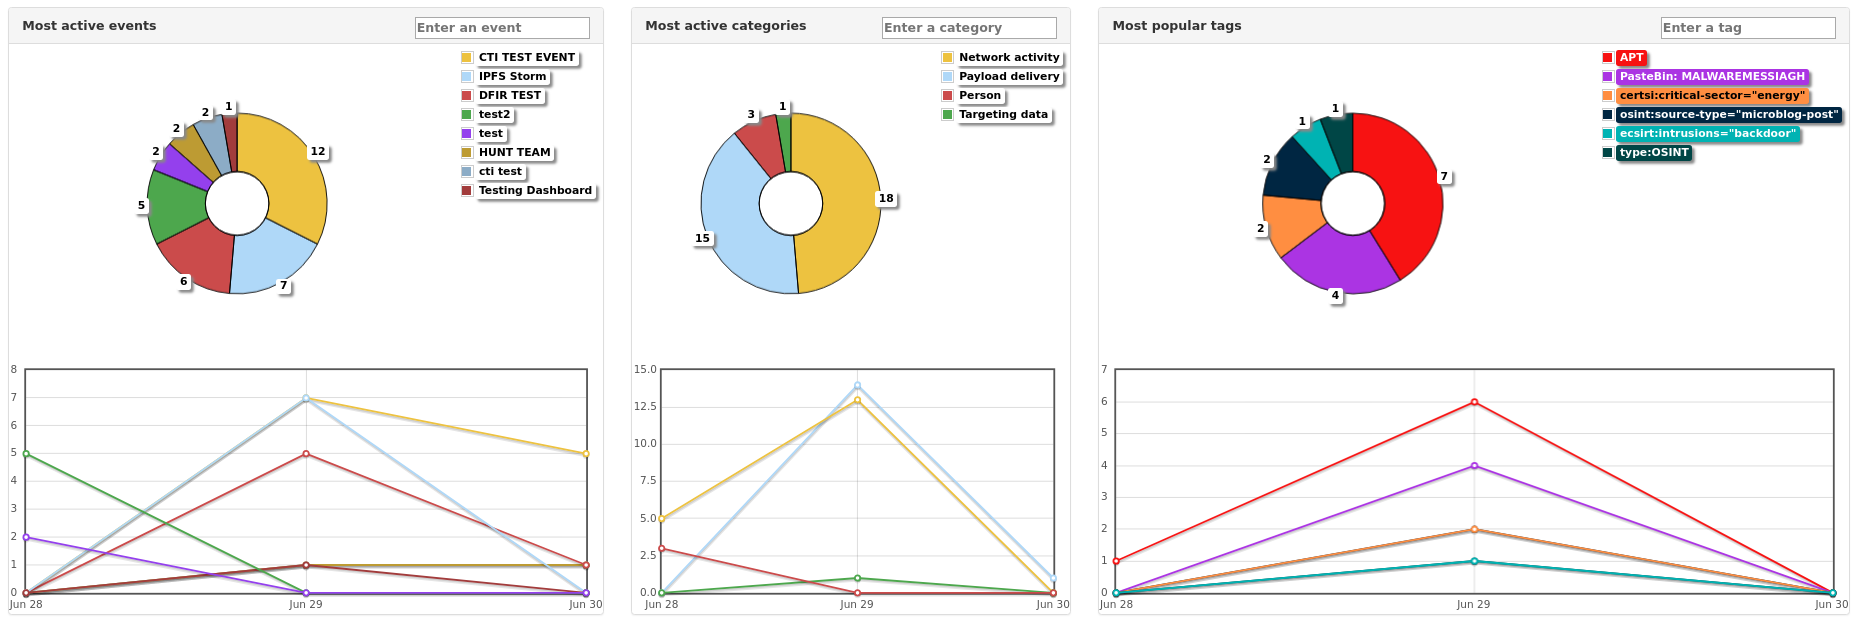
Most Active Events dashboard displays combined activity on MISP events.
Most Active Categories dashboard displays activity grouped by attribute category.
A visualization of active categories is a good high level indication of activity within your network. Where normally payload delivery might average below some threshold, a sudden spike can indicate progression through the attack lifecycle, or an outbreak.
Most Popular Tags dashboard reports the total count of tags on both attributes and events.
This dashboard is also very useful but I’d like to see it more narrowly focused. It would be better refactored into several dashboards to communicate trends on particular taxonomies and galaxies in MISP. For instance, a dashboard displaying only tags of MITRE ATT&CK techniques, or their respective categories in the ATT&CK matrix. Or a dedicated malware dashboard for malware taxonomy tags to help focus short-term research efforts on those trending malware families.
Looking forward, I’d like to see tag aggregation extended to a global scale. For now, there’s no way easy way to break down MISP data into industries and sectors. Exploring global trends across industry is something I’ve heard folks ask about many times. It makes sense too, because there’s value in knowing which malware families are trending in finance vs those in energy. Or which threat actors are targeting a particular sector, or how an actor’s techniques change between industries.
What might a heat map of the MITRE ATT&CK matrix look like for a particular industry over the last n weeks?
MISP Trendings could be really interesting for those working with complex MISP configurations, and where automated enrichment is present. Where multiple instances are deployed, dashboards can be used to show trends across the each instance.
This is useful because knowledge of which tags are trending on a malware sandbox has different utility than knowledge of which tags are trending in actual internal incidents. This extends to honeypots, spam traps, EDR, and basically any situation where we might want a narrow focus.
MISP Live Dashboard
The live dashboard streams attributes in real time.
The attributes are listed with their basic properties such as tags and category. The live stream supports filters which can be applied to incoming attributes, their parent event, and org.
This dashboard might work on display in a SOC to show security analysts (especially those working in a SIEM) what the CTI folks and other teams are up to.
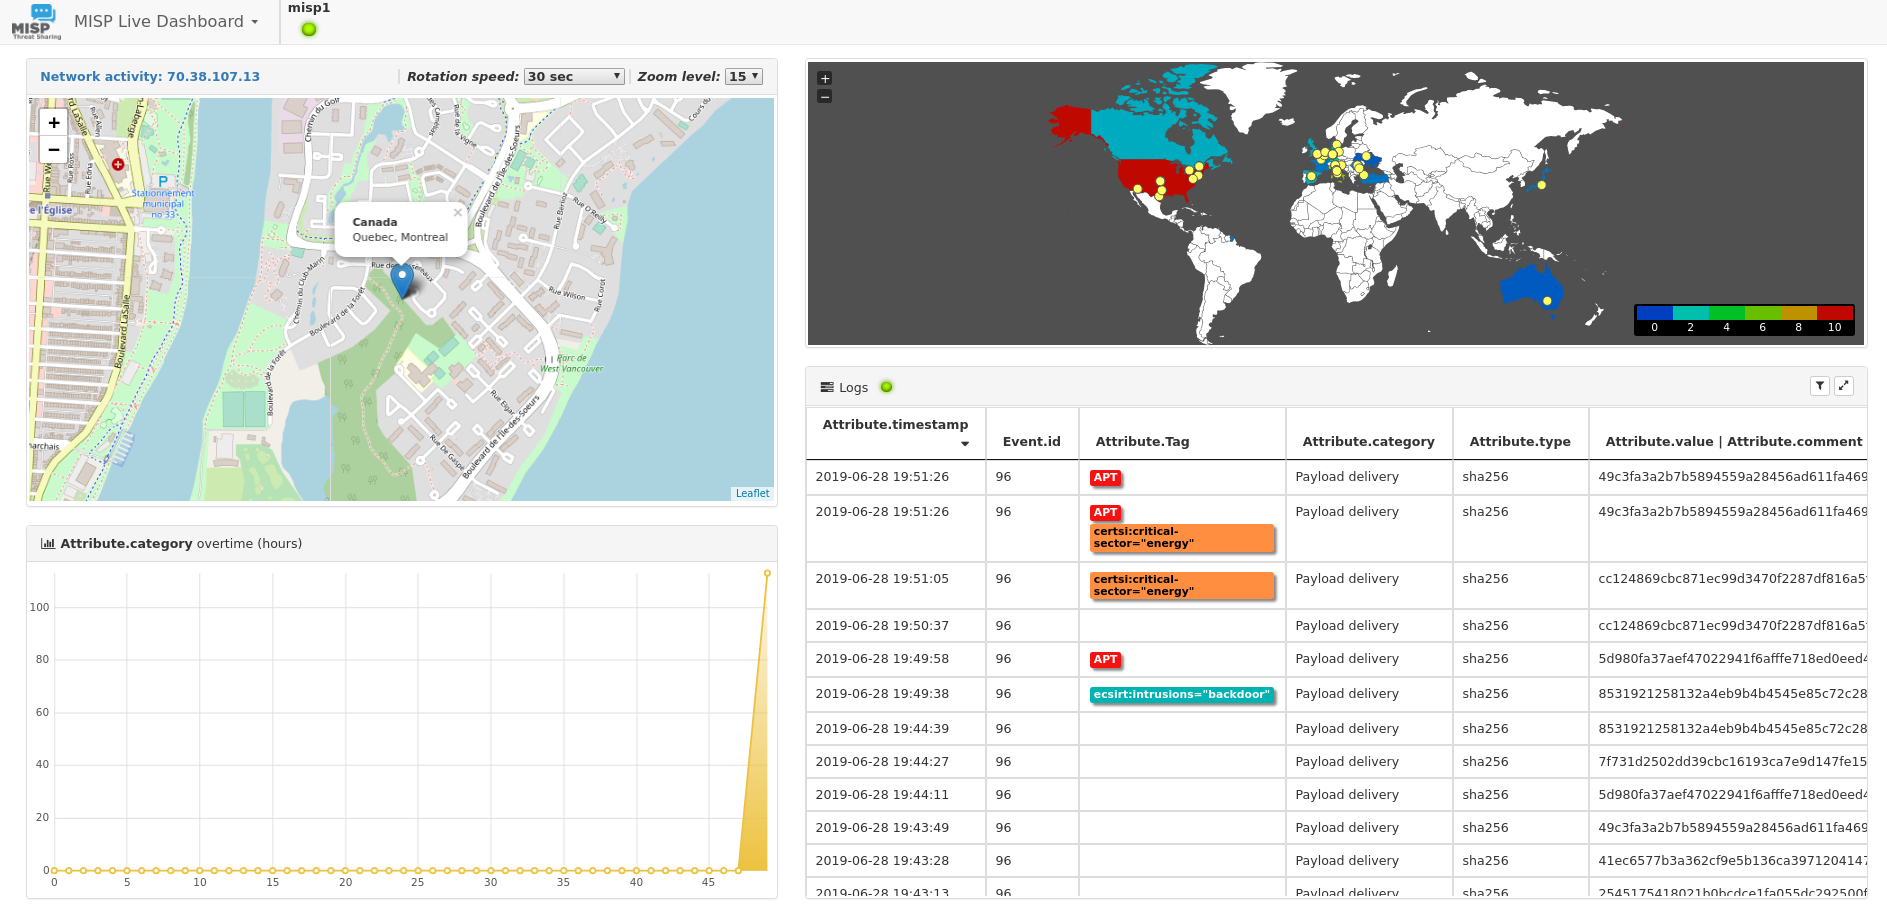
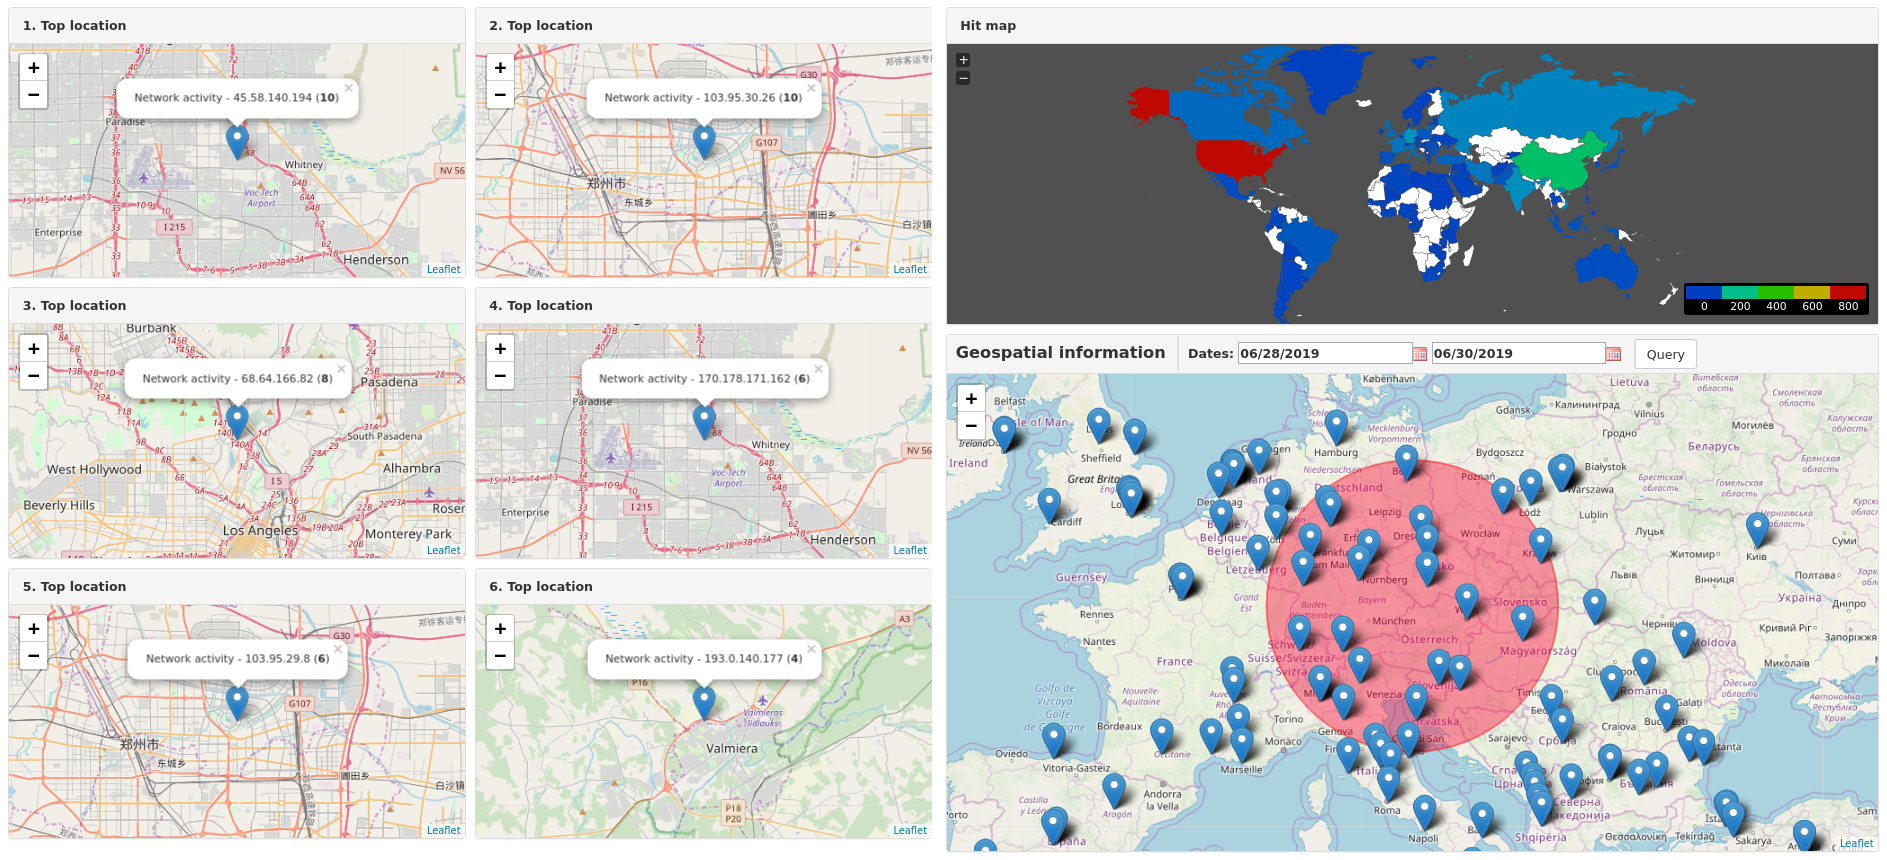
MISP Geolocalisation Dashboard
Maps. This dashboard shows the location of network activity on a map.
The Geolocalisation Dashboard does not support filters, but it could be extended to filter on tags, actors, etc.
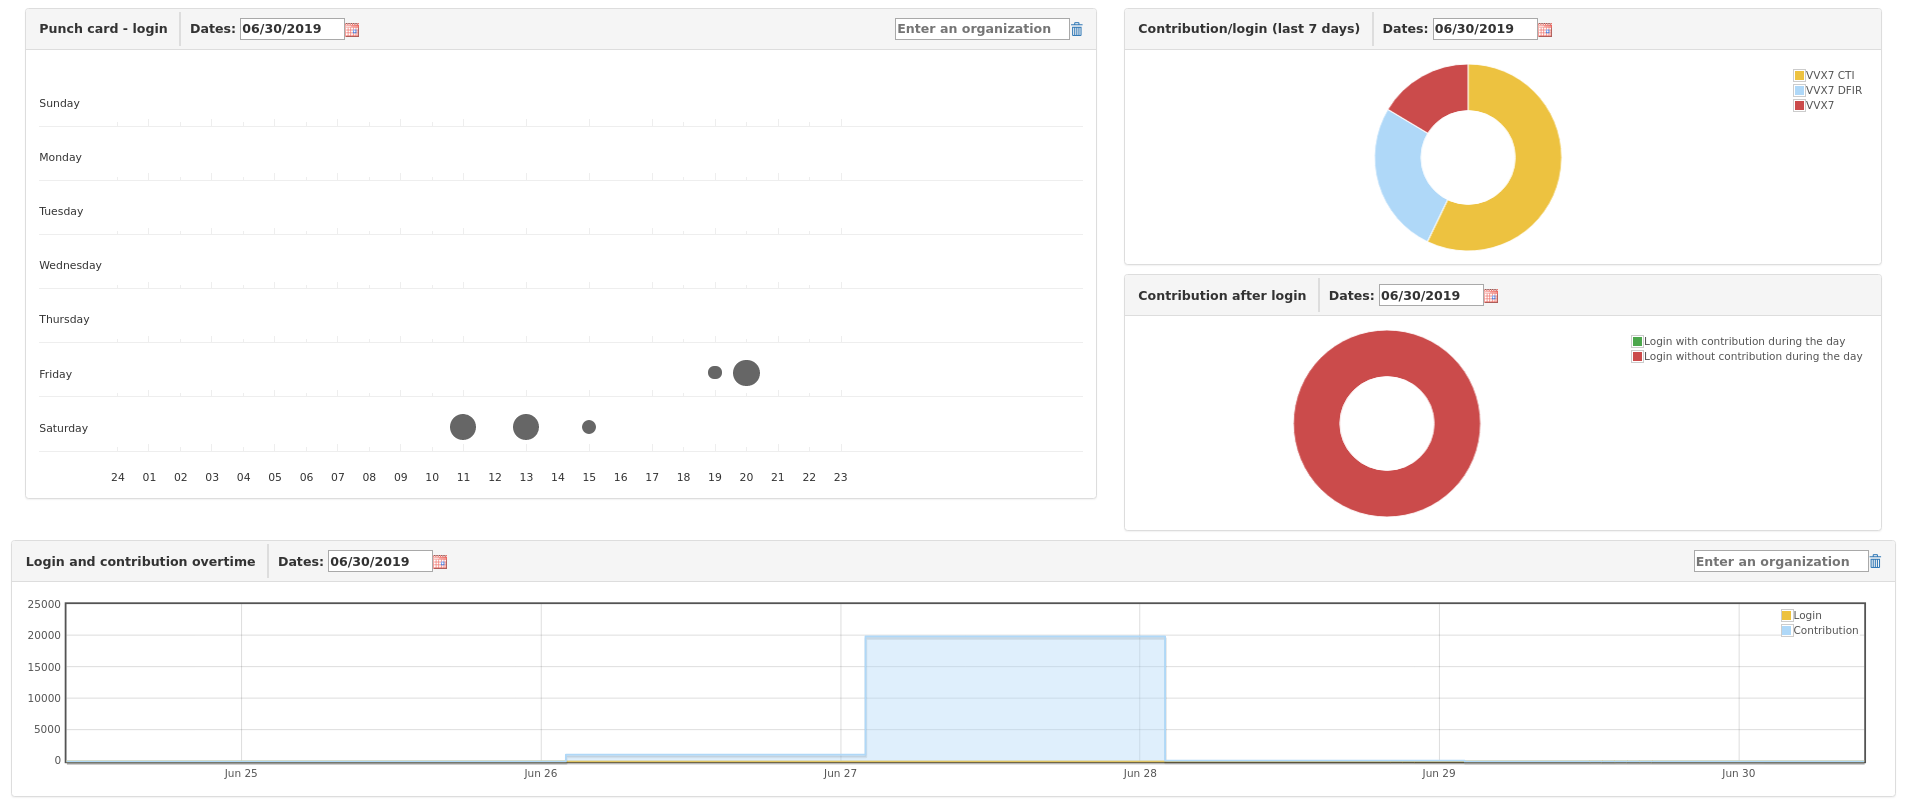
MISP Users Dashboard
Punch in. Punch out.
This dashboard shows when users are active but also the users’ daily contributions through a bubble plot.
This dashboard could be extended to show which categories of attributes each user contributes, the frequency of reported sightings, or contributions to contextual information (tags, blogs, etc).
Install MISP-Dashboard
We’re going to install misp-dashboard using mod_wsgi. It will start automatically on boot, and we don’t need to worry about exposing a Flask app to our network this way.
To install misp-dashboard on a new MISP instance use the MISP installer with the -D switch.
# -c : core
# -M : modules
# -D : dashboard
wget -O /tmp/INSTALL.sh https://raw.githubusercontent.com/MISP/MISP/2.4/INSTALL/INSTALL.sh
bash /tmp/INSTALL.sh -cMD
To install misp-dashboard on an existing MISP instance just use the -D switch function without the rest of the installer script. The function is pasted below. It assumes you’re using a Debian based system.
# Main MISP Dashboard install function

WWW_USER="www-data"
SUDO_WWW="sudo -H -u ${WWW_USER} "
PATH_TO_MISP='/var/www/MISP'
CAKE="$PATH_TO_MISP/app/Console/cake"

mispDashboard () {
  debug "Install misp-dashboard"
  # Install pyzmq to main MISP venv
  debug "Installing PyZMQ"
  $SUDO_WWW ${PATH_TO_MISP}/venv/bin/pip install pyzmq
  cd /var/www
  sudo mkdir misp-dashboard
  sudo chown $WWW_USER:$WWW_USER misp-dashboard

  $SUDO_WWW git clone https://github.com/MISP/misp-dashboard.git
  cd misp-dashboard
  sudo -H /var/www/misp-dashboard/install_dependencies.sh
  sudo sed -i "s/^host\ =\ localhost/host\ =\ 0.0.0.0/g" /var/www/misp-dashboard/config/config.cfg
  sudo sed -i '/Listen 80/a Listen 0.0.0.0:8001' /etc/apache2/ports.conf
  sudo apt install libapache2-mod-wsgi-py3 net-tools -y
  echo "<VirtualHost *:8001>
      ServerAdmin admin@misp.local
      ServerName misp.local

      DocumentRoot /var/www/misp-dashboard

      WSGIDaemonProcess misp-dashboard \
         user=misp group=misp \
         python-home=/var/www/misp-dashboard/DASHENV \
         processes=1 \
         threads=15 \
         maximum-requests=5000 \
         listen-backlog=100 \
         queue-timeout=45 \
         socket-timeout=60 \
         connect-timeout=15 \
         request-timeout=60 \
         inactivity-timeout=0 \
         deadlock-timeout=60 \
         graceful-timeout=15 \
         eviction-timeout=0 \
         shutdown-timeout=5 \
         send-buffer-size=0 \
         receive-buffer-size=0 \
         header-buffer-size=0 \
         response-buffer-size=0 \
         server-metrics=Off

      WSGIScriptAlias / /var/www/misp-dashboard/misp-dashboard.wsgi

      <Directory /var/www/misp-dashboard>
          WSGIProcessGroup misp-dashboard
          WSGIApplicationGroup %{GLOBAL}
          Require all granted
      </Directory>

      LogLevel info
      ErrorLog /var/log/apache2/misp-dashboard.local_error.log
      CustomLog /var/log/apache2/misp-dashboard.local_access.log combined
      ServerSignature Off
  </VirtualHost>" | sudo tee /etc/apache2/sites-available/misp-dashboard.conf

  # Enable misp-dashboard in apache and reload
  sudo a2ensite misp-dashboard
  sudo systemctl restart apache2

  # Needs to be started after apache2 is reloaded so the port status check works
  $SUDO_WWW bash /var/www/misp-dashboard/start_all.sh

  # Add misp-dashboard to rc.local to start on boot.
  sudo sed -i -e '$i \sudo -u www-data bash /var/www/misp-dashboard/start_all.sh > /tmp/misp-dashboard_rc.local.log\n' /etc/rc.local
}
# <snippet-end 4_misp-dashboard.sh>

# <snippet-begin 4_misp-dashboard-cake.sh>
dashboardCAKE () {
  # Enable ZeroMQ for misp-dashboard
  $SUDO_WWW $CAKE Admin setSetting "Plugin.ZeroMQ_enable" true
  $SUDO_WWW $CAKE Admin setSetting "Plugin.ZeroMQ_event_notifications_enable" true
  $SUDO_WWW $CAKE Admin setSetting "Plugin.ZeroMQ_object_notifications_enable" true
  $SUDO_WWW $CAKE Admin setSetting "Plugin.ZeroMQ_object_reference_notifications_enable" true
  $SUDO_WWW $CAKE Admin setSetting "Plugin.ZeroMQ_attribute_notifications_enable" true
  $SUDO_WWW $CAKE Admin setSetting "Plugin.ZeroMQ_sighting_notifications_enable" true
  $SUDO_WWW $CAKE Admin setSetting "Plugin.ZeroMQ_user_notifications_enable" true
  $SUDO_WWW $CAKE Admin setSetting "Plugin.ZeroMQ_organisation_notifications_enable" true
  $SUDO_WWW $CAKE Admin setSetting "Plugin.ZeroMQ_port" 50000
  $SUDO_WWW $CAKE Admin setSetting "Plugin.ZeroMQ_redis_host" "localhost"
  $SUDO_WWW $CAKE Admin setSetting "Plugin.ZeroMQ_redis_port" 6379
  $SUDO_WWW $CAKE Admin setSetting "Plugin.ZeroMQ_redis_database" 1
  $SUDO_WWW $CAKE Admin setSetting "Plugin.ZeroMQ_redis_namespace" "mispq"
  $SUDO_WWW $CAKE Admin setSetting "Plugin.ZeroMQ_include_attachments" false
  $SUDO_WWW $CAKE Admin setSetting "Plugin.ZeroMQ_tag_notifications_enable" false
  $SUDO_WWW $CAKE Admin setSetting "Plugin.ZeroMQ_audit_notifications_enable" false
}
# <snippet-end 4_misp-dashboard-cake.sh>
MISP-Dashboard is installed in /var/www/misp-dashboard/.
The script adds a line to rc.local to start misp-dashboard services on boot. Start them manually or reboot the system.
cd /var/www/misp-dashboard/
./start_all.sh
Verify that everything is working correctly.
# diagnostic.py must be run in a virtual env
source DASHENV/bin/active
./diagnostic.py

✔ Virtual environment and packages
✔ Configuration
✔ File permission
✔ Redis
✔ Zmq
✔ Processes status: Both processes are running
✔ Subscriber status: subscriber is running and populating the buffer
ℹ Buffer queue: Currently 1 items in the buffer
✔ Buffer change rate: Buffer is consumed faster than being populated
✔ Dispatcher status: Took 0.72s to complete
✔ Server listening: http://127.0.0.1:8001/_get_log_head reached. Status code [200]
✔ Server dynamic enpoint: Dynamic endpoint returned data (took 2.88s)
Dashboard logs are stored in the local logs folders /var/www/misp-dashboard/logs/.
ZMQ logs are stored in /var/www/misp/app/tmp/log/.
Refer to the misp-dashboard GitHub page or MISP Support Gitter for additional troubleshooting support.
Closing Thoughts
The one major issue I take with this project is that it violates the Unix principle of Do One Thing and Do It Well. A platform that explores the value of gamification in cyber threat intelligence is long overdue, but folks familiar with Kibana or SIEMs are likely to find the non-gamification dashboards a little underwhelming.
Most of the current dashboards I expect an organisation working with a SIEM and MISP to have already developed. For those just getting started, given the choice between building dashboards in Splunk or Kibana, or coding JavaScript in misp-dashboards, I think the majority would chose to use a SIEM. It makes sense. Those resources are already available. It’s a single pane of glass. There’s no need to introduce additional complexity. Kibana supports Vega.
Overall, it’s a net positive experience.
MISP-Dashboard get’s it right with gamification. It’s likely to change a lot as the project matures, but the core concept is solid because gamification isn’t something that can be bolted on to a SIEM. A leaderboard and it’s various badges contain a huge amount of potential for getting orgs to actively compete with each other, whether on a global scale or internally, and it’s a brave new direction for the MISP project.
While the future of misp-dashboard may be uncertain, there’s something undeniably cyberpunk about engineering a corporate culture of gamified cyber threat intelligence and it’s intersection with actors who would subvert that system.